Home›System
Monitoring System
Monitoring system
See the same screens from the office or on site, on a PC or a smartphone. As well as checking energy use, you receive the order in which to check things when an anomaly occurs, and reports for meter reading, billing and reporting are generated automatically.
Real-time
Real-time power monitoring
on PC and smartphone
Check power data in real time for the whole facility or for a single piece of equipment. There is no software to install, so you can open it straight from a web browser.
- Check current power, cumulative use and peak power
- Move between screens by building, floor, zone and equipment
- Monitor several buildings from one screen
- Per-user permissions so each person sees only what they need
- Screen language: Korean, Japanese and English
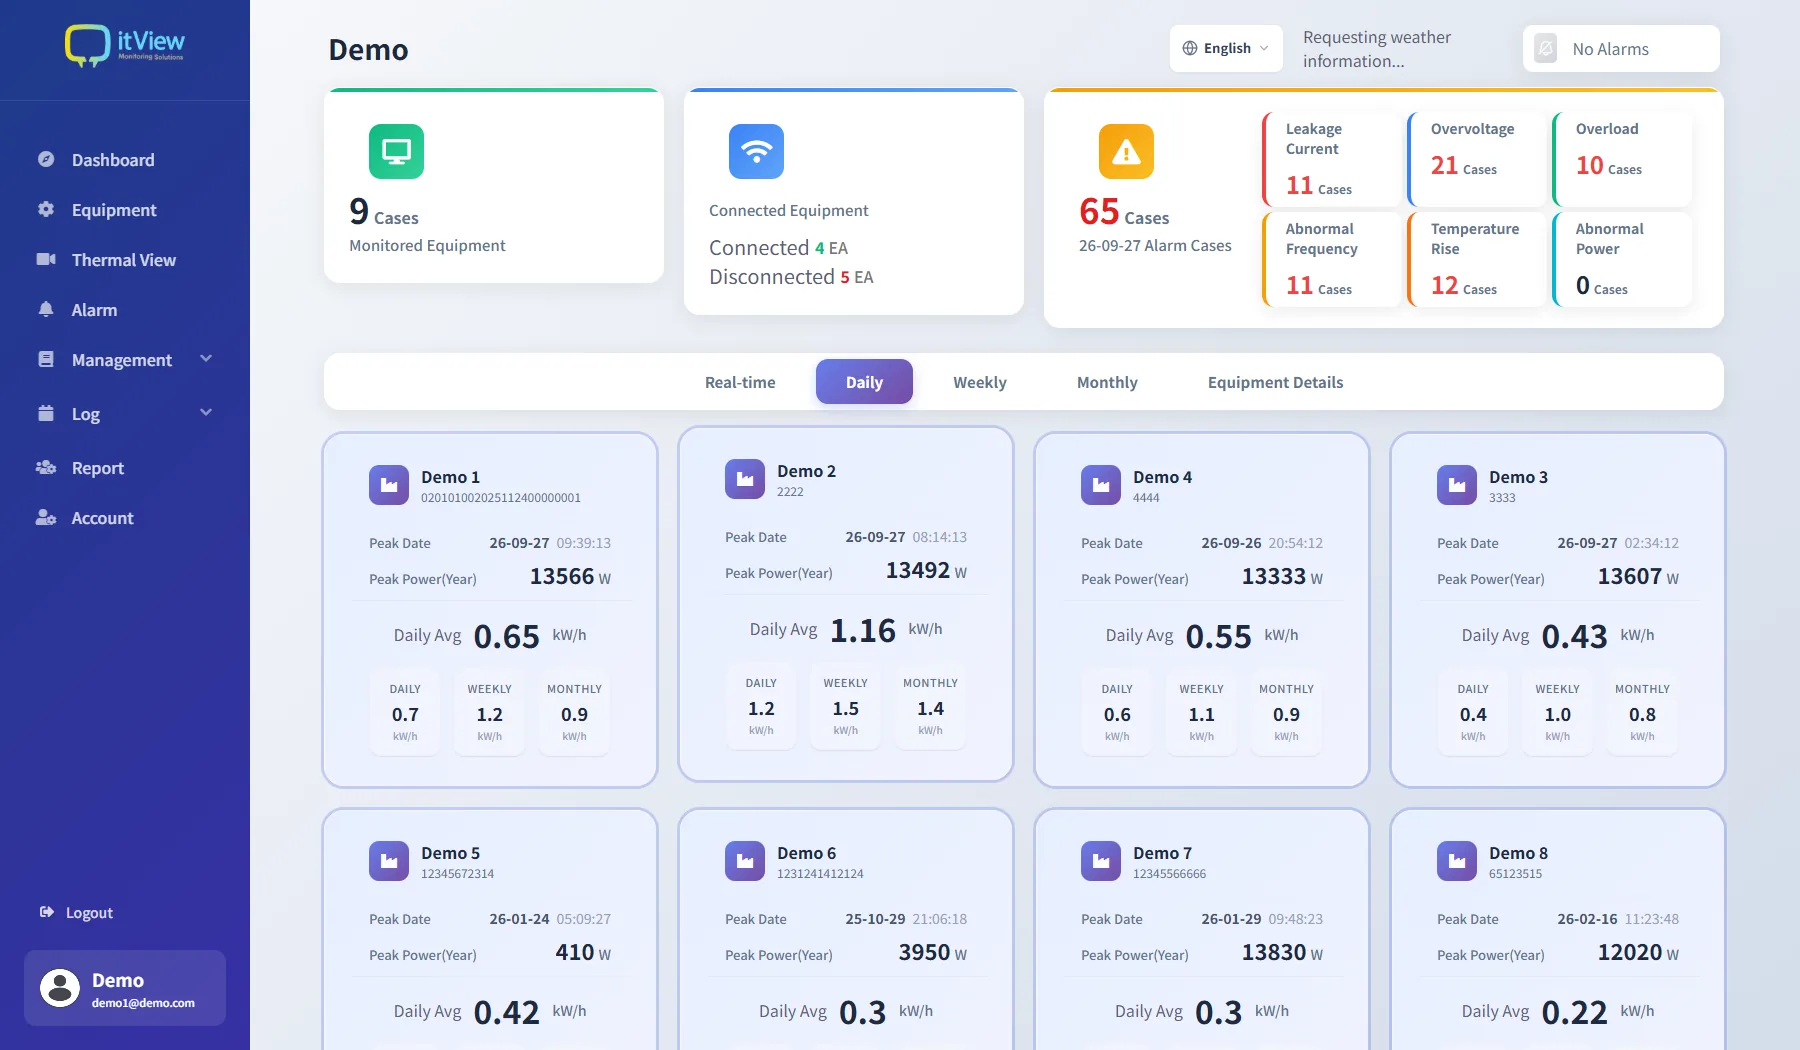 Actual monitoring screen · tap to see more
Alert
You are notified as soon as something is wrong
When a risk signal is detected, the manager is notified at once. Because you are told what happened and where, checking the site takes less time.
Overload, overvoltage
Detects loads and voltages that exceed the thresholds you set, and sends an alarm.
Abnormal patterns
Detects overload, current imbalance and usage patterns that differ from the norm.
Fire risk (temperature rise)
Sends an alarm at once when the panel temperature passes the threshold.
Thermal Camera
Watching panel temperature
as a live image In development
We are developing a function that connects a thermal imaging camera so you can see the temperature of panels and equipment as an image. The aim is to show anomalies that are hard to spot by eye, such as an overheating contact, and to keep them on record. Today the system provides temperature rise alarms from a temperature sensor.
- Temperature rise alarms (available now)
- Real-time thermal image per machine (in development)
- Maximum, minimum and average temperature display (in development)
- Screen captures kept as inspection records (in development)
Thermal imaging is still in development.
Please contact us and we will share the expected timing.
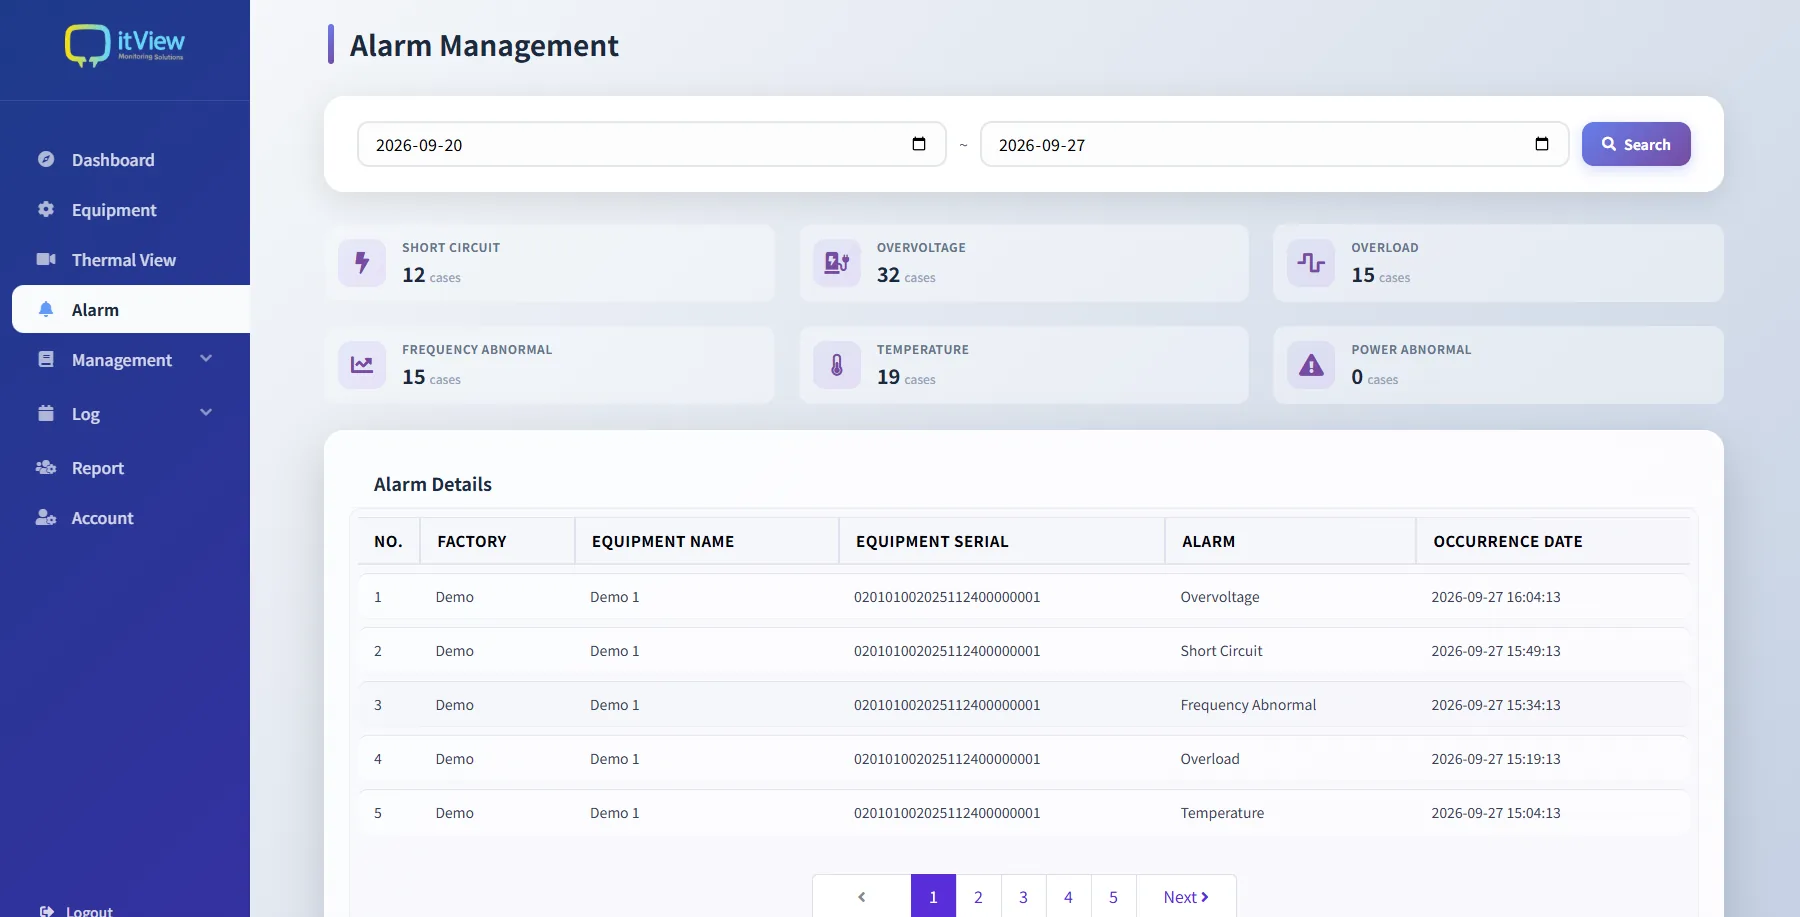 Alarm management screen · tap to see more
Action Guide
What an alarm
contains
When an anomaly is detected, you are told which machine, what kind of problem and when it occurred. From the alarm alone, staff can decide what to check first.
- Shows the affected machine and its panel location
- Six categories of anomaly
- Records the time of occurrence and whether it persists
- Alarm history searchable by period
Cost Saving
Find where to cut
in your usage patterns
Compare use by hour, by day and by month to see where power is concentrated. Looking at use outside working hours, or differences between machines, shows where you can cut.
- Find the hours where use is concentrated
- Check use outside working hours
- Compare use between machines
Remote Check
Check the data first,
before visiting the site
Check panel status and equipment data remotely to cut out unnecessary site visits. A facility management company running several buildings can cut travel time considerably.
- Remote status check before a visit
- Decide which equipment to inspect first
- Record and share inspection results
Report
Automate meter reading,
billing and reporting
Energy use is compared by hour, day, month and year, and can be downloaded as a file. That cuts the time spent on meter reading and reporting.
Usage report
Sets out use by period and the share taken by each machine.
Period comparison
Compares use with the same period last month or last year.
File download
Download the report you opened as a file and use it for reporting.
Log records
Search equipment and user activity records by period.
Would you like to see
the monitoring system?
Take a look at the actual monitoring screens, or ask us about the setup that suits your site.